The Analyze Data tab within a Client’s profile allows the application of different graphing features for the visual display of progress.
...
Program Data Collection Type | Graphing Filters for Skills | Skill Acquisition Examples | Graphing Filters for Behaviors | Behavior Examples |
|---|---|---|---|---|
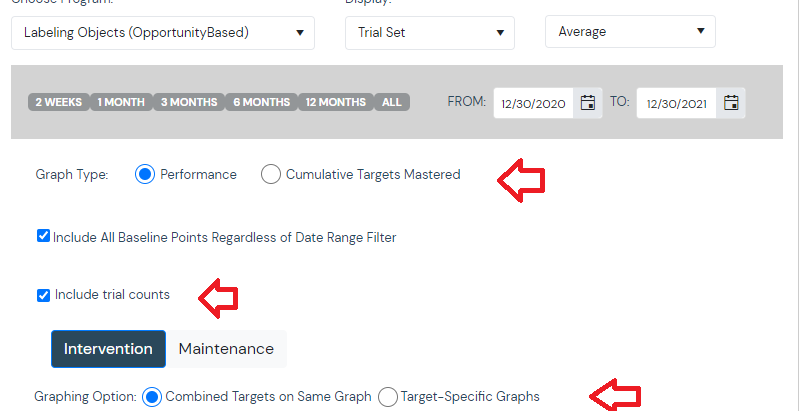
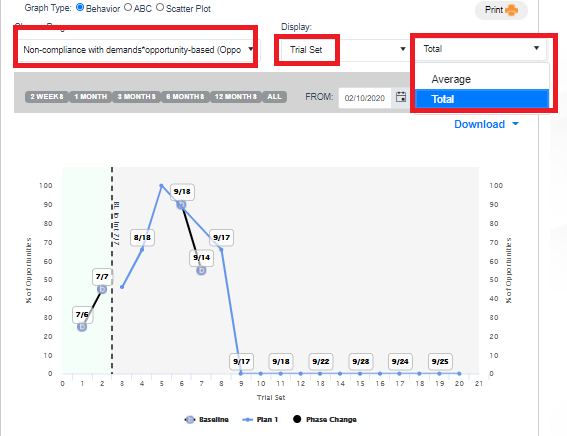
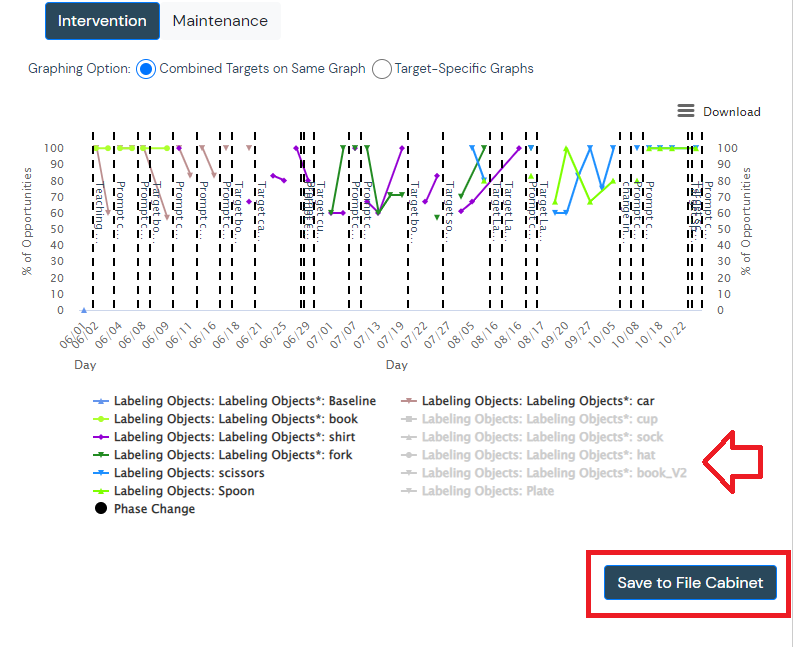
Opportunity Based Programs | Ability to view graphs by Day, Week, Month, Year, or Trial SetCan view trial counts when filtered to Trial SetAbility to view performance or cumulative targets masteredAbility to view Average vs. TotalView trial count per session with or without promptsIf choosing COMBINED TARGETS ON SAME GRAPH, you can de-select targets or phase change lines, by clicking on the name at the bottom | Filtering Views and Dates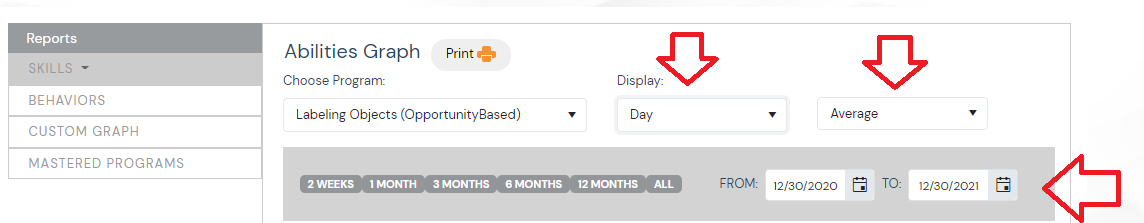 | Ability to view Behavior data, ABC data, or Scatter Plot dataAbility to view graphs by Day, Week, Month, Year, or Trial SetAbility to view Average vs Total |
|
Additional Filter Options
 | ||||
De-Selecting Targets when using COMBINED TARGETS ON SAME GRAPH
| ||||
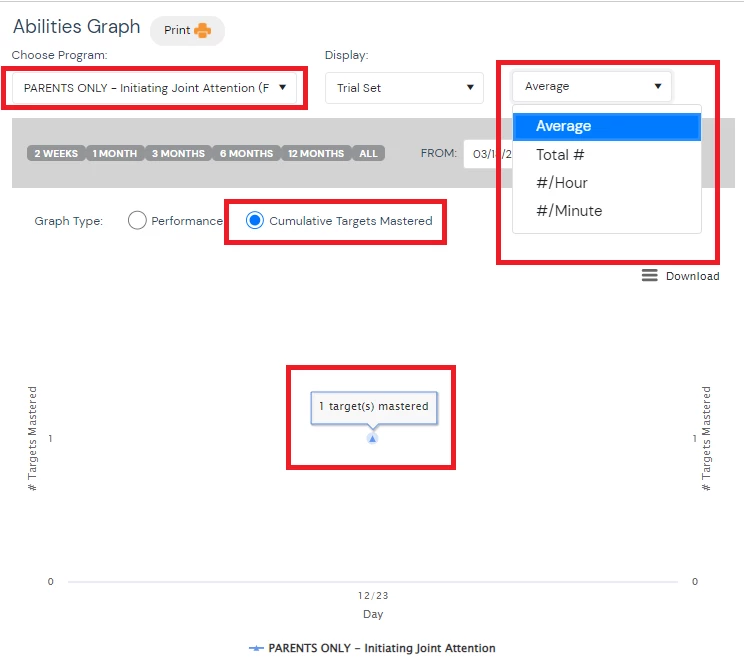
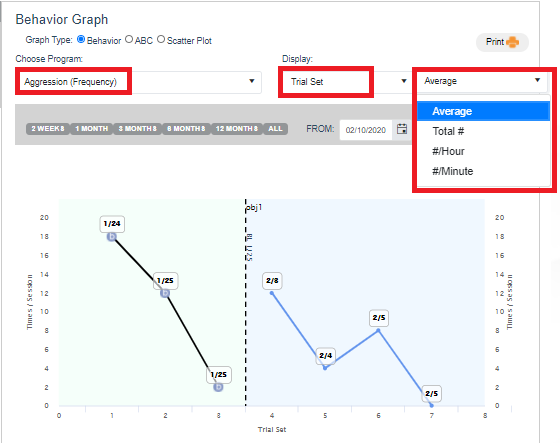
Frequency Programs | Ability to view graphs by Day, Week, Month, Year, or Trial SetAbility to also view by total #, #/hour, or #/minuteAbility to view performance or cumulative targets mastered for skillsAbility to view Average vs. Total #, #/Hour, and #/Minute | Filter Options 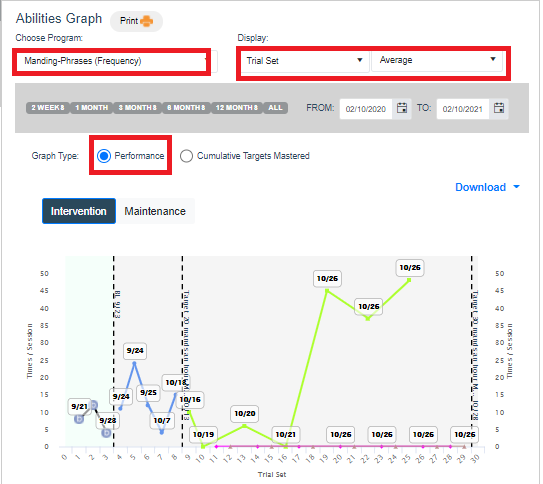 | Ability to view Behavior data, ABC data, or Scatter Plot dataAbility to view graphs by Day, Week, Month, Year, or Trial SetAbility to also view by total #, #/hour, or #/minute | Rate Options
|
 | ||||
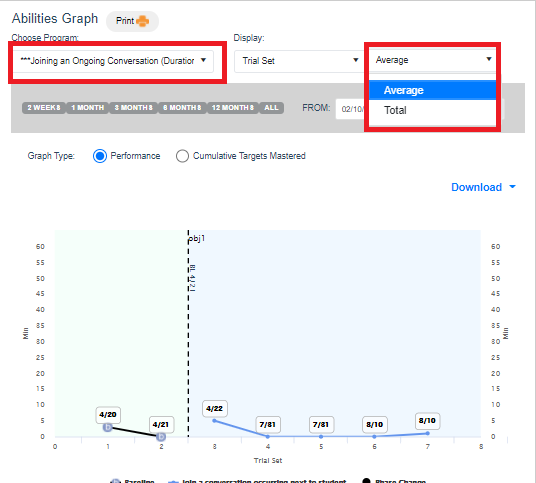
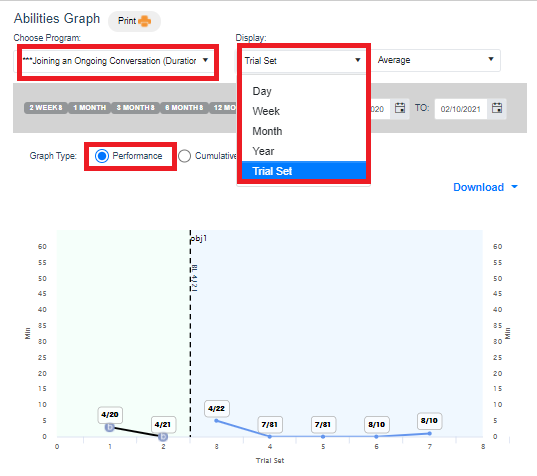
Duration Programs | Ability to view graphs by Day, Week, Month, Year or Trial Set,Ability to view graphs by performance or cumulative targets mastered for skillsAbility to view Average vs. Total |
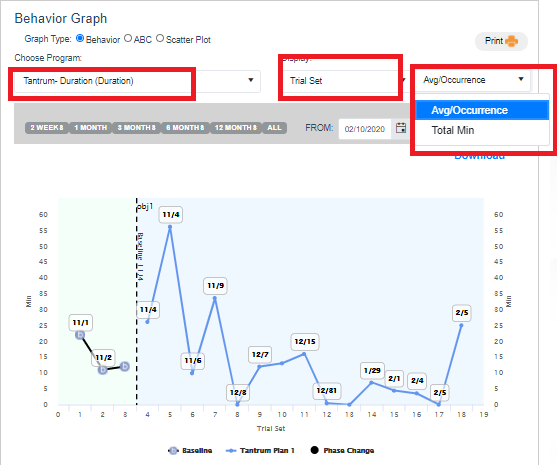
| Ability to view Behavior data, ABC data, or Scatter Plot dataAbility to view graphs by Day, Week, Month, Year, or Trial SetAbility to also view by Total Minutes or Average/Occurrence |
|
 | ||||
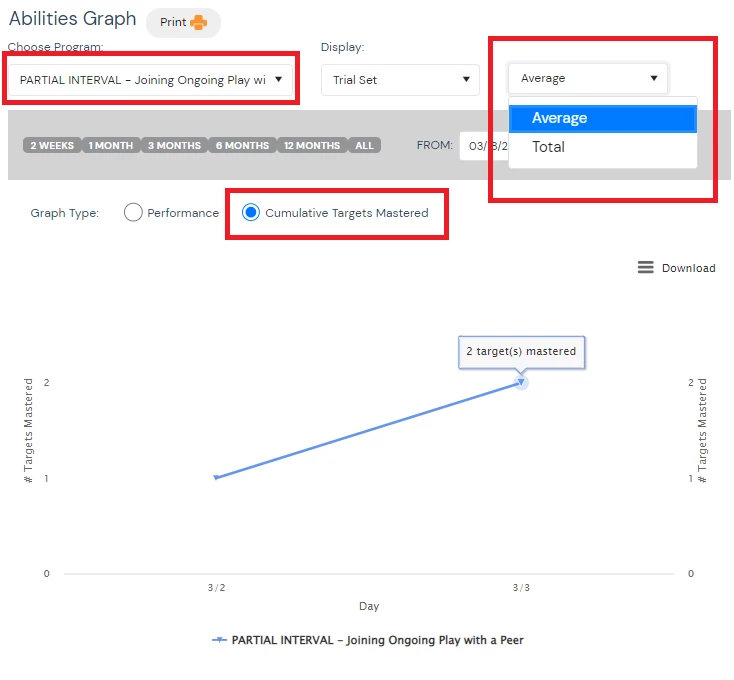
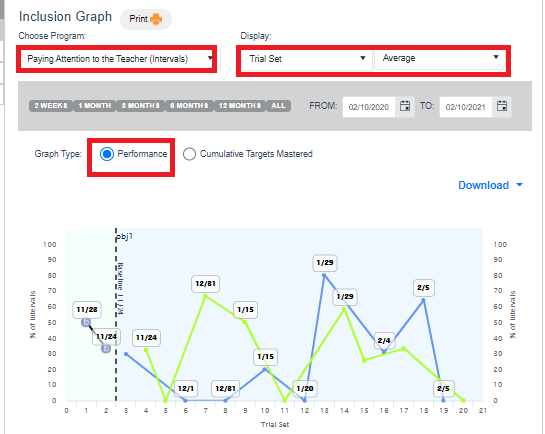
Interval Programs | Ability to view graphs by Day, Week, Month, Year or Trial SetAbility to view graphs by performance or cumulative targets masteredAbility to view Average vs. Total |
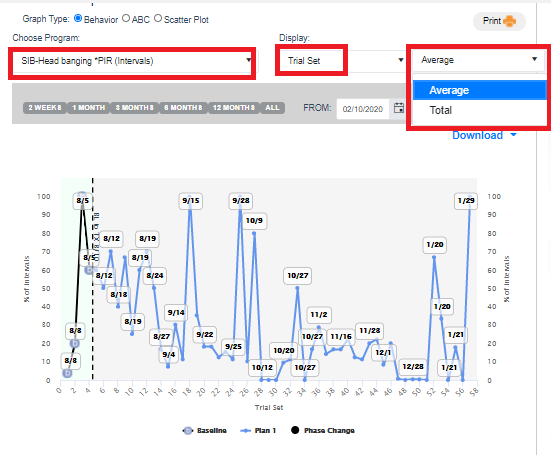
| Ability to view Behavior data, ABC data, or Scatter Plot dataAbility to view graphs by Day, Week, Month, Year, or Trial SetAbility to view % of Intervals |
|
 | ||||
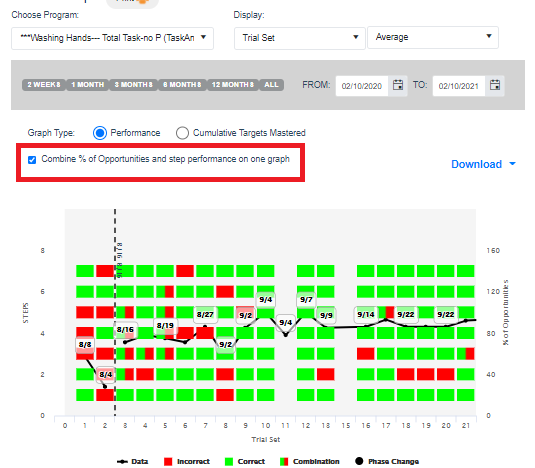
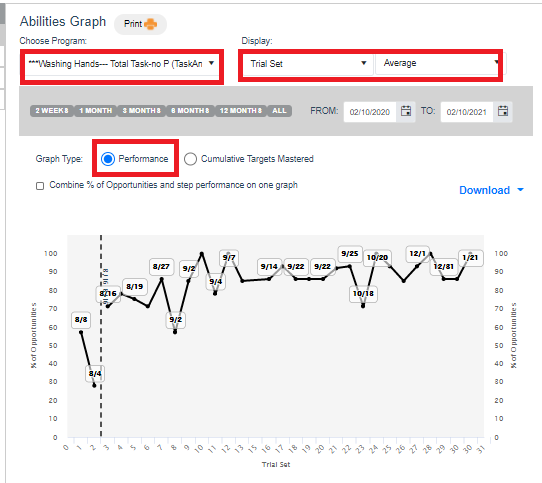
Task Analysis Programs | Ability to view graphs by Day, Week, Month, Year or Trial SetAbility to view graphs by performance or cumulative steps masteredAbility to view Average vs TotalAbility to combine % of opportunities and step detail graph |
| ||
 |
Adding Trend Lines to Graphs
Trend lines can be added to graphs within the Analyze Data tab of a Client’s profile.
A minimum of 3 data points is required for a trendline to be added.
Once in the Analyze Data tab, and a graph is displayed, select the Customize option in the top right corner to add a trend line.
Trendlines can be added within phases or across phases.
...
Questions? support@rethinkbh.com