When using cumulative graphs in analyze data and in funder reports, you will now see consistency between the two areas. All exports will also show this improvement in analyze data. See additional details below:
Area | Description | Good to Know! |
|---|---|---|
Analyze Data with Skill Acqusition programs | Cumulative Graphs for Teaching: 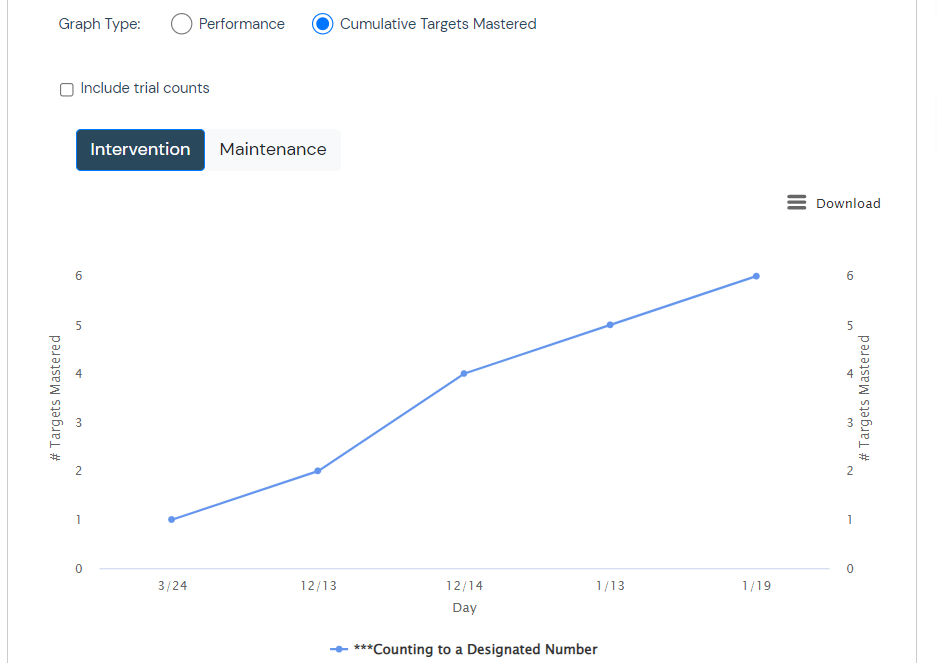 Cumulative Graphs for Maintenance: 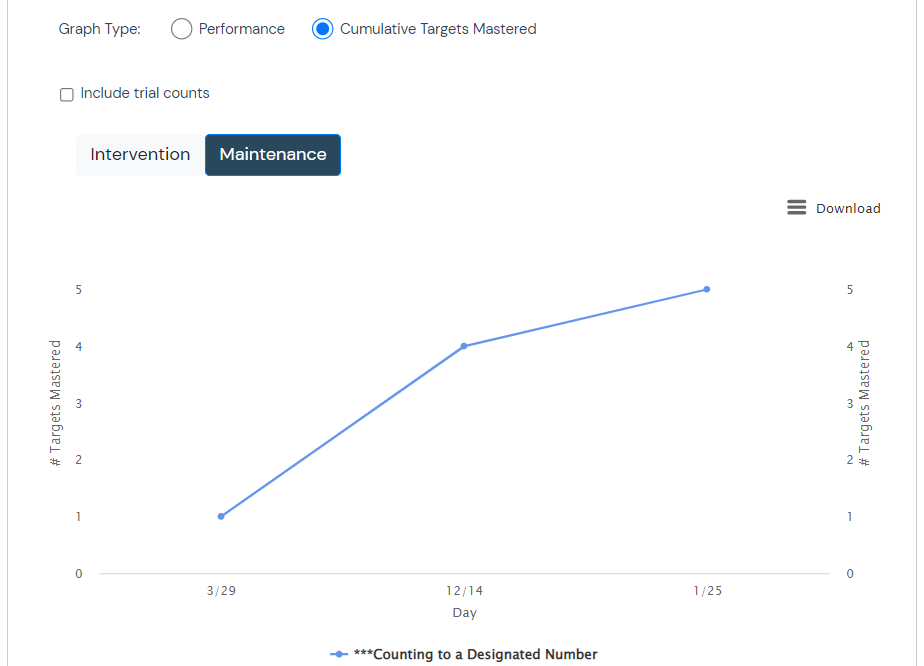 |
|
Comparing Analyze Data and Funder Reports | When using cumulative graphs in both Analyze Data and Funder Reports, these will now look the same when using different filters. Analyze Data Cumulative Graph: Funder Report Cumulative Graph: 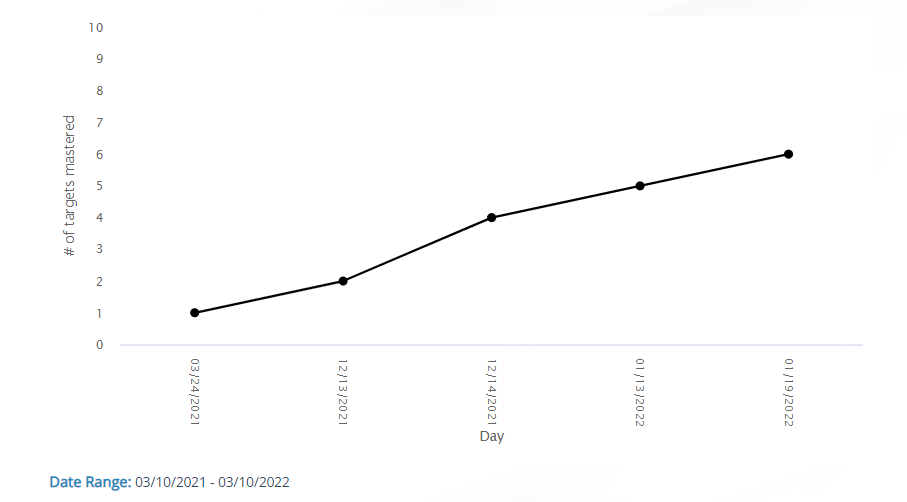 |